The market had a good day with the benchmark Nifty50 getting back above 19,500 mark on October 5, ahead of the interest rate decision by the Monetary Policy Committee scheduled on October 6. Hence, the next crucial resistance to focus on would be 19,600-19,700 for the index, whereas the immediate support is expected to be at 19,500, followed by 19,350 area in coming sessions, experts said.
The benchmark indices snapped two-day losing streak. The BSE Sensex jumped over 400 points to 65,632, and the Nifty50 rose 110 points to 19,546, while the market breadth was positive, supporting the broader markets. The Nifty Smallcap 100 index gained six-tenth of a percent, while the Nifty Midcap 100 index was flat.
Key sectors provided good support to the benchmarks with the Bank Nifty rising 249 points to 44,213, and the Nifty IT climbing 314 points to 32,125.
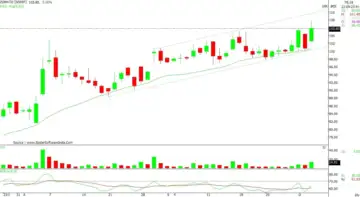
Stocks that were in action on Thursday included Zomato, Sobha, and Nazara Technologies. Zomato recouped all its previous day’s losses and jumped 4.6 percent to Rs 105.4, forming bullish candlestick pattern with long upper shadow on the daily charts, indicating profit taking at higher levels. The trading volume was strong, with the stock holding all key moving averages.
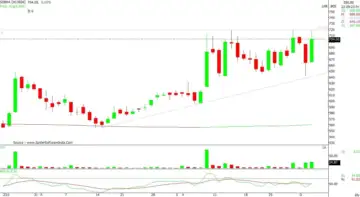
Sobha rallied 6.5 percent to Rs 707, the highest closing level since September 15 last year, and formed strong bullish candlestick pattern on the daily timeframe while taking a good support at 20-day EMA (exponential moving average placed at Rs 667). The trading volume was strong.
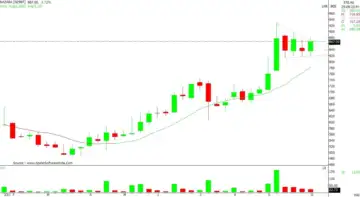
Nazara Technologies also traded above all key moving averages, rising more than 5 percent to Rs 866 and formed long bullish candlestick pattern on the daily scale after several days of consolidation. The trading volume was above average with Rs 800 seems to be a strong support.
Here’s what Shrikant Chouhan of Kotak Securities recommends investors should do with these stocks when the market resumes trading today:
The stock is trading in an Ascending Triangle chart pattern on the daily scale. Moreover, the strong up move on the daily chart suggest that the stock is likely to breakout for further bullish momentum from the current levels.
For positional traders, Rs 670 would be the trend decider level. Trading above the same uptrend formation will continue till Rs 750. However, if it closes below Rs 670, traders may prefer to exit from trading long positions.

After the sharp upward rally, the stock went into the consolidation mode, which resulted in the formation of a Flag chart pattern on weekly scale. The recent formation in the stock is representing a bullish continuation pattern, which is signifying a new leg of up move from the current levels.
For the traders, Rs 830 would be the key support level to watch out. Above which, the uptrend structure should continue until Rs 930.

On the daily scale, the counter is into a rising channel chart formation with a higher low series pattern constantly. The technical indicator like RSI (relative strength index) is also indicating further up trend from current levels which could boost the bullish momentum in coming horizon.
As long as the counter is trading above Rs 101, the uptrend formation is likely to continue. Above which, the counter could move up to Rs 114.

Disclaimer: The views and investment tips expressed by investment experts on Moneycontrol.com are their own and not those of the website or its management. Moneycontrol.com advises users to check with certified experts before taking any investment decisions.


 Driving Naari Programme launched in Chandigarh


