Equity benchmark index Nifty remained in a sideways movement ahead of the release of India’s inflation data. It sustained its position above a critical near-term moving average, indicating stability in the market.
Whereas, the relative strength index (RSI) showed a bearish crossover, suggesting a potential weak momentum. For the week, analysts at Axis Securities expect Nifty to trade in the range of 19000-18200 with a mixed bias.
On June 9, Nifty closed at Rs 18,563 level with a gain of 29 points on a weekly basis. On the weekly chart, the index has formed a bearish candle with an upper shadow indicating selling at higher levels.
The chart pattern suggests that if Nifty crosses and sustains above Rs 18,700 level it would witness buying which would lead the index towards 18900- 19000 levels. However if the index breaks below 18450 level, it would witness selling which would take the index towards 18300-18200.
Meanwhile, the Bank Nifty index has been trading in a range-bound manner, indicating a lack of clear direction in the market. For the week, analysts expect Bank Nifty to trade in the range of 44500-43500 with a mixed bias.
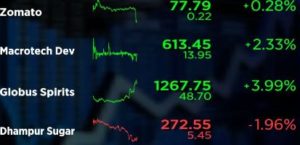
Here are Axis Securities’ weekly top 4 technical picks —
Based on the technical factors, the brokerage has suggested four stocks — Zomato, Macrotech Developers, Dhampur Sugar Mills and Globus Spirits — that investors can look to buy and hold for the next three to four weeks.
Zomato Ltd: On the weekly chart, Zomato has formed a “Double Bottom” pattern and successfully broken above its neckline at the 75 level. This breakout indicates a positive trend in the stock’s price, presenting an opportunity for potential upward movement.
The stock is well placed above 20, 50 and 100 daily simple moving average (SMA), indicating a positive momentum. The weekly strength indicator relative strength index (RSI) is holding above its reference line indicates positive momentum.
The brokerage has given a buying range between Rs 75-72. The above analysis indicates an upside of 83-90 levels (13 – 22 percent) with a stop loss at Rs 69. Holding period is 3 to 4 weeks.
Macrotech Developers Ltd: Shares of Macrotech Developers (formerly Lodha Developers), has broken out above the medium-term “Falling Channel” pattern at 548 on the weekly chart. The strong bullish candle confirms an uptrend,reflecting a positive momentum in the stock.
The stock is forming higher high-low formation on weekly chart, indicating a positive momentum. The weekly strength indicator RSI is in a bullish mode and RSI crossover above its reference line generated a buy signal.
The brokerage has given a buying range between Rs 580-570. The above analysis indicates an upside of 655-685 levels (14 – 19 percent) with a stop loss at Rs 535. Holding period is 3 to 4 weeks.
Dhampur Sugar Mills Ltd: On the weekly chart, Dhampur Sugar Mills has decisively broken out above the ‘Consolidation Zone ‘ between 272-200levels. During the consolidation period, the trading volume exhibited a noticeable decline. However, at the point of breakout, there was a significant surge in volume, suggesting a renewed influx in volume, suggesting a renewed influx of market participants.
The stock holds above 61.8 percent Fibonacci Retracement of a rally from 55-491 placed at 221 forming a medium term support zone. The weekly strength indicator RSI is holding above its reference line indicates positive momentum.
The brokerage has given a buying range between Rs 274-269. The above analysis indicates an upside of 313-327 levels (15 – 20 percent) with a stop loss at Rs 250. Holding period is 3 to 4 weeks.
Globus Spirits Ltd: On the weekly chart, Globus Spirits has decisively broken out above the medium term ‘Rounded Bottom’ pattern at 1120 with a strong bullish candle, indicating a positive momentum. The weekly ‘Bollinger band’ generated buy signal as stock closed above the upper Bollinger Band.
It has found support at the 61.8 percent Fibonacci retracement level, calculated from the rally between 60 and 1747 and placed at 704. This level acts as a significant medium-term support zone, indicating an upward movement.
The weekly strength indicator RSI is holding above its reference line indicates a positive momentum.
The brokerage has given a buying range between Rs 1180-1158. The above analysis indicates an upside of 1340-1370 levels (15 – 17 percent) with a stop loss at Rs 1082. Holding period is 3 to 4 weeks.


 Driving Naari Programme launched in Chandigarh


